Previous Posts in
Data Corner
FEBRUARY 2024
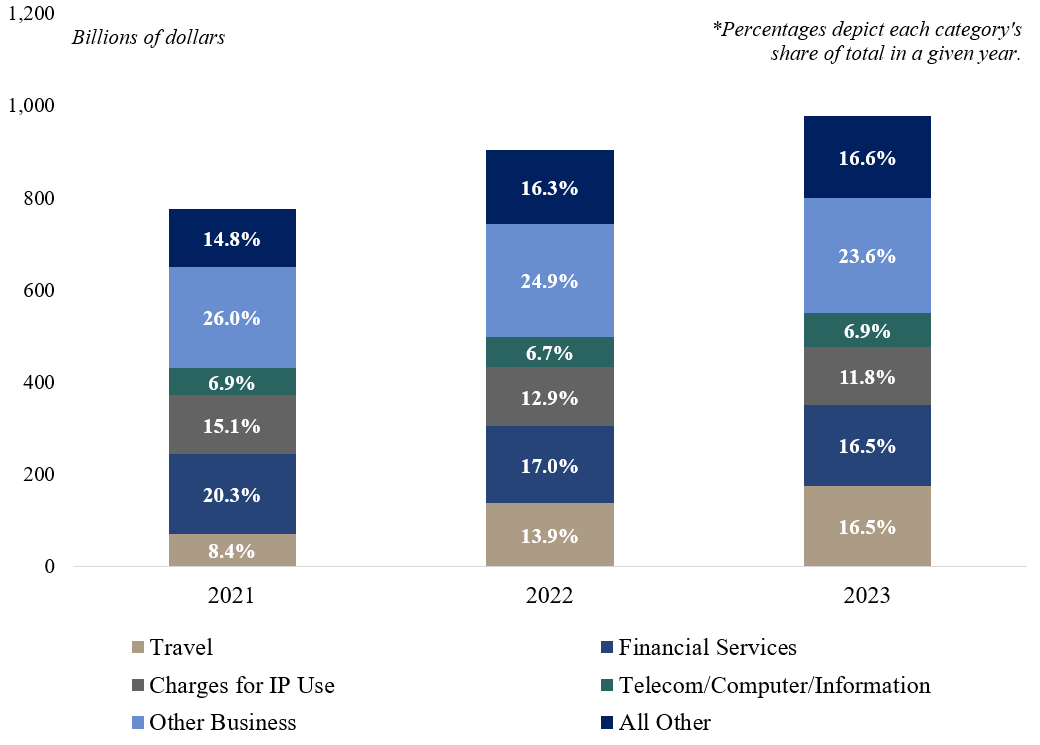
Source: U.S. Census Bureau. Chart depicts services exports only.
Services Exports Continue to Climb While Goods Imports Declined On an Annual Basis
December exports of services were the highest on record at $87.0 million (though this continuous upward trend is normal for services exports). Total services exports increased 8.0 percent from 2022 to 2023, after increasing 15.9 percent the previous year. Much of the total $201.6 billion increase over the 2021 to 2023 period depicted in the graph — little more than half — is attributable to the rebound in travel (to the U.S.), which is classified as an export. However, travel as a share of overall GDP is still slightly lower than it was just prior to the pandemic.
Goods imports increased in December but declined on an annual basis from 2022, a year during which consumption and goods imports were notably high. For instance, imports as a share of GDP in 2022 (15.4 percent) were the highest since 2014 (16.4 percent), declining to 14.0 percent in 2023. In 2023, the trade deficit decreased fairly markedly, as imports decreased $142.7 billion (3.6 percent) and exports increased $35.0 billion (1.2 percent).
JANUARY 2024
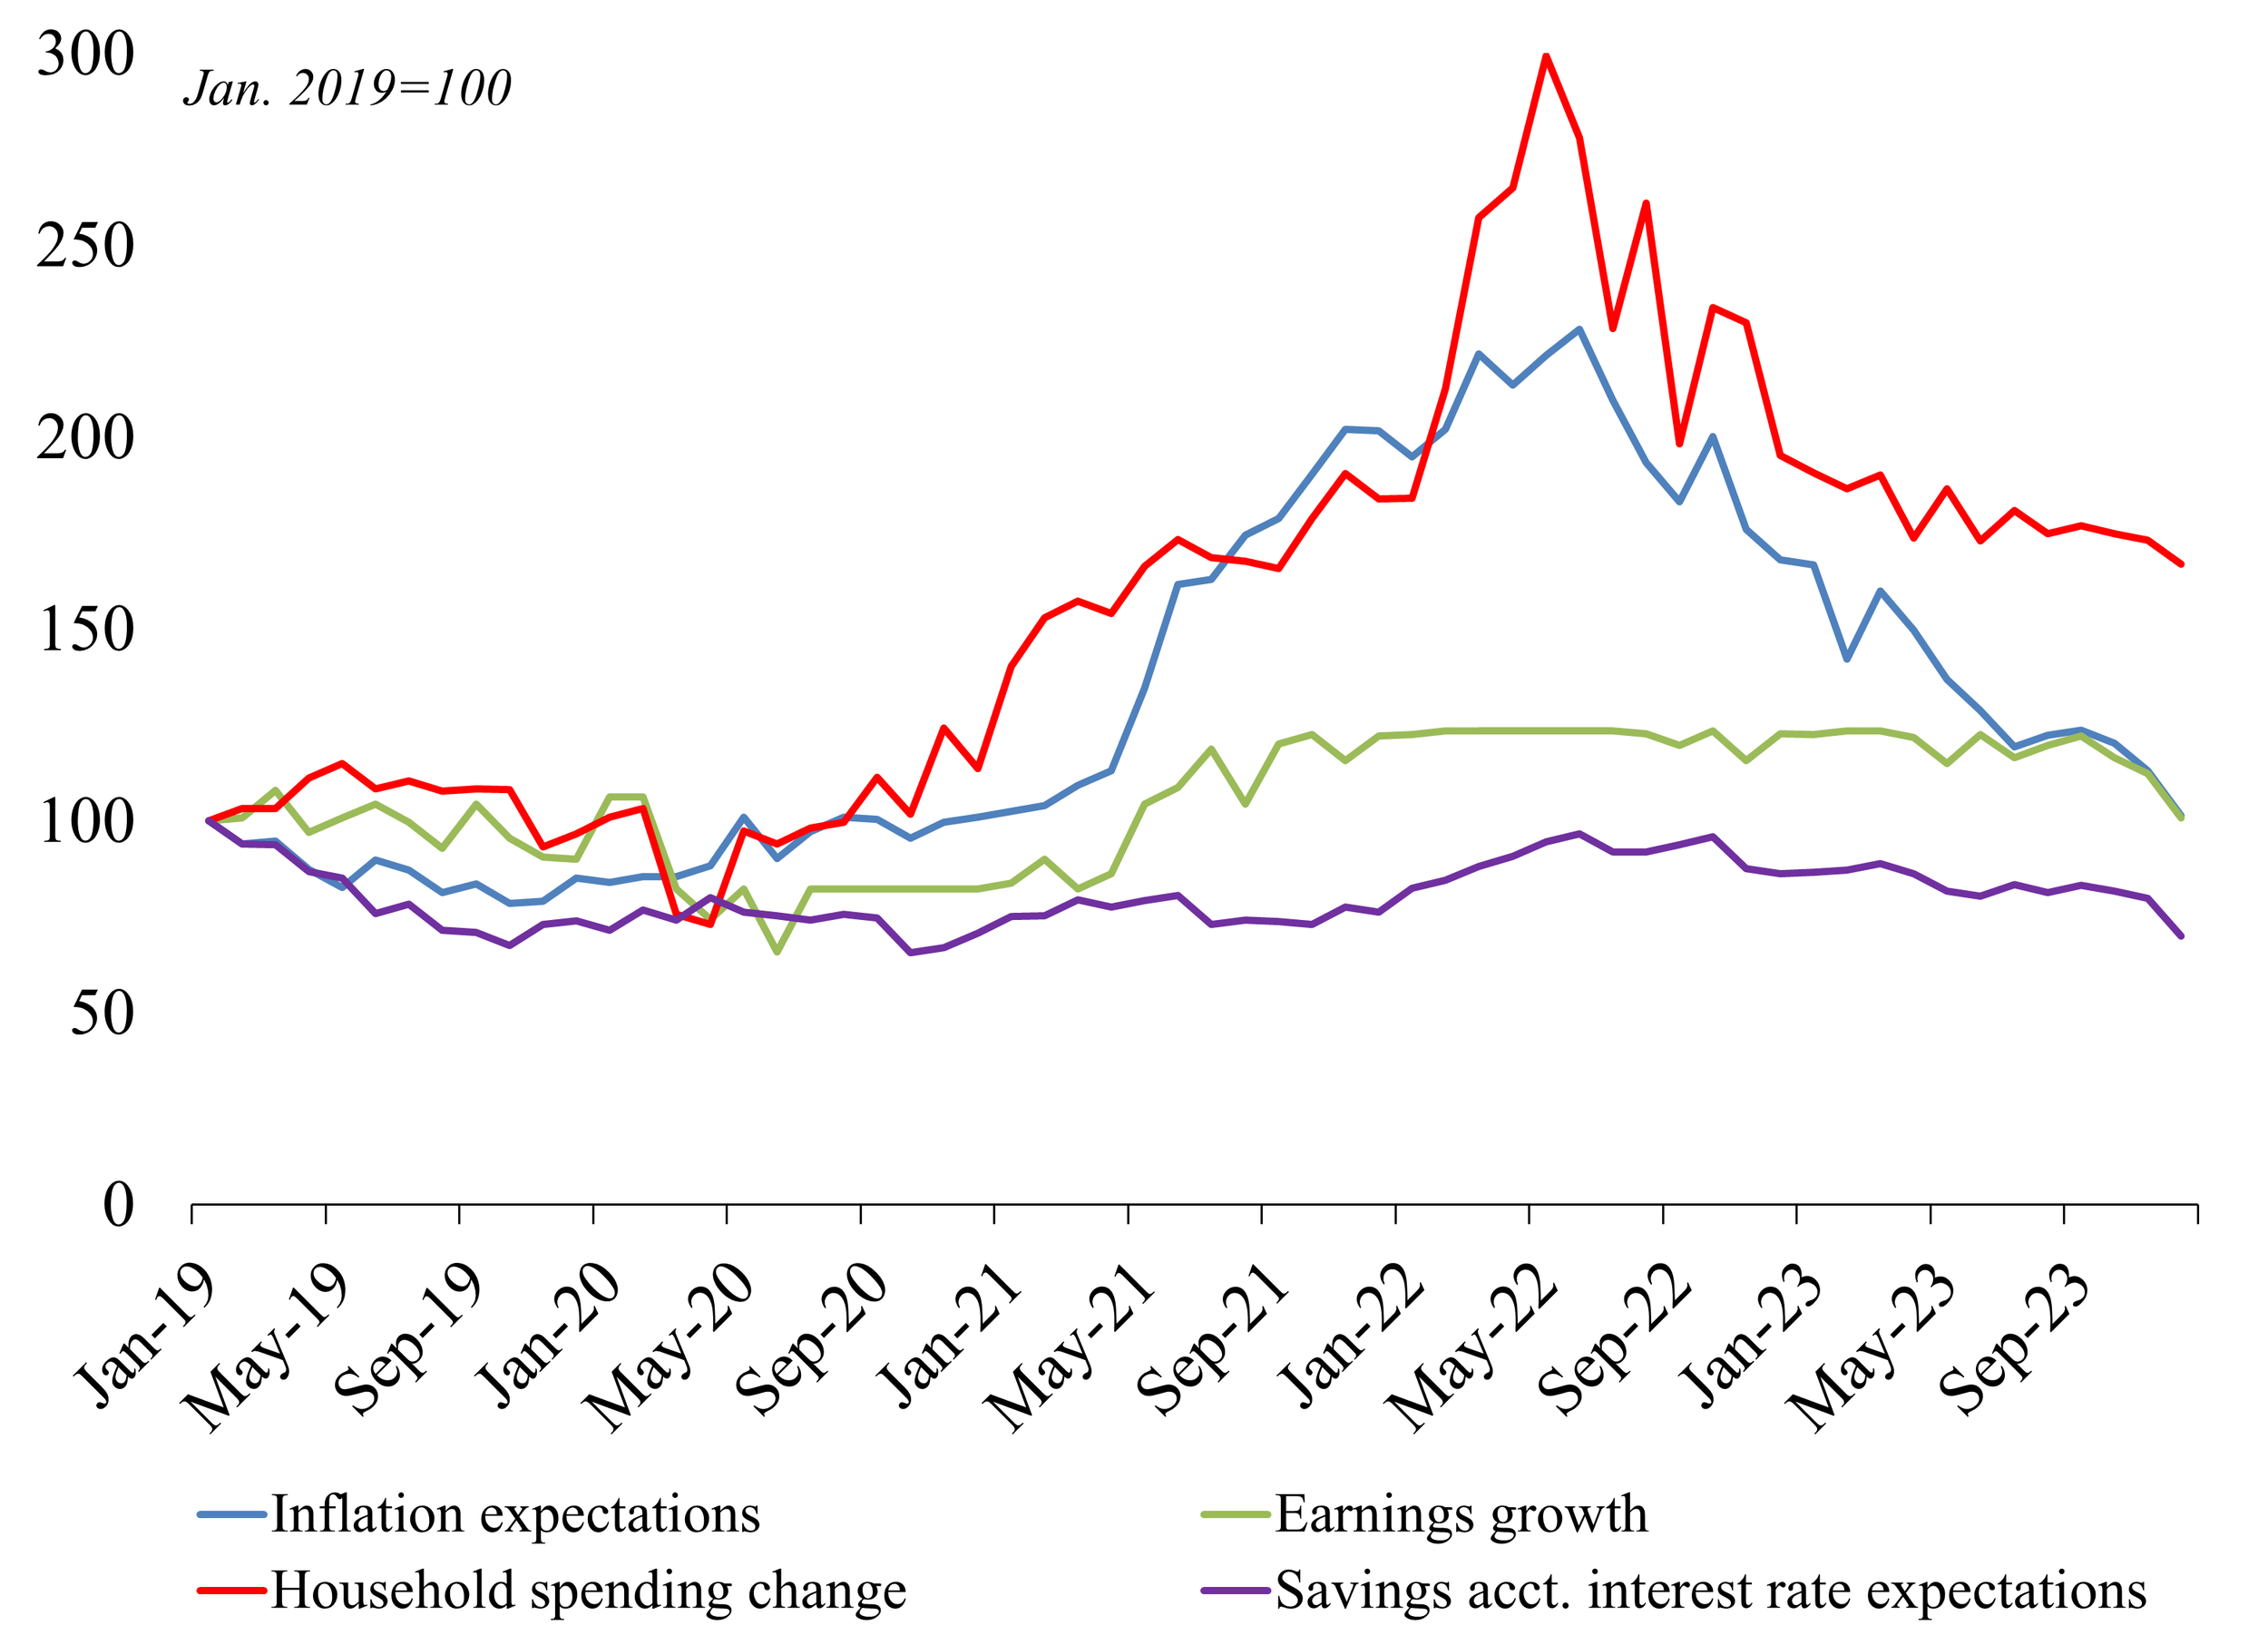
Source: Bureau of Economic Analysis.
Are Americans Beginning to Feel Differently About the Economy?
Last year, the sharp contrast between positive economic indicators and negative public opinion was a common theme among economic commentary. Inflation had been slowing to near-normal rates, real wages outpaced inflation alongside historic unemployment lows, and net worth (i.e. wealth) increased across income groups. Yet, public sentiment regarding the economy was exceedingly negative — a sentiment that spanned demographic groups and political persuasions. Much of this frustration is of course attributable to higher prices compared to just a couple years ago, even though consumer spending remained strong both throughout and following the period of high inflation.
Recent Survey of Consumer Expectations data from the Fed indicate that consumer outlook may be adjusting, though it is unclear what impact it may have. Inflation expectations (one year out from survey date) are at their lowest level in three years. Interest rate expectations also declined, and consumers’ outlook on their household financial situation (a separate measure not depicted in the graph) became less pessimistic. Interestingly, earnings growth and spending expectations also continued to decline, which may signal or even contribute to a return to a comparatively normal economic environment.
NOVEMBER 2023
Source: Bureau of Economic Analysis.
Personal Consumption Expenditures Remain Strong in September
Personal consumption expenditures (PCE) increased 0.7 percent in September from the previous month — higher than expected and reflecting continuously strong consumer spending. The increase was 0.4 percent when adjusted for inflation. The $138.7 billion increase (nominal dollars) for the month included $96.2 billion in spending for services and a $42.5 billion increase in spending for goods. International travel, airfare, and housing led the increase in services, while the goods spending increase was driven by new autos and prescription drugs.
Over the coming months, economists will be closely monitoring whether this pace of spending continues or drops sharply in the next quarter. Many consumers who built up savings during the pandemic have already depleted them, and several others may be close to following suit — especially those whose student loan payments have resumed. Yet, many analysts still consider household debt burdens relatively low, and several consumers may increase reliance on credit to maintain spending levels, especially as incomes have generally increased relative to inflation. The Fed will also consider PCE data over the coming months as part of its federal funds rate response. Data for October will be released on the final day of the month.
OCTOBER 2023
Source: International Monetary Fund.
IMF Projects Slowing Global Growth Through 2024
In its semiannual World Economic Outlook report, the International Monetary Fund projects slowing growth through 2024, ticking back upwards in 2025. Receding, yet stubbornly high, inflation remains a constraint, with fiscal tightening across central banks at or past their peaks in rate hiking cycles.
Divergences abound both between and within advanced and emerging economies, with advanced economies proceeding much more slowly than emerging and developing ones. The U.S. has positively exceeded growth expectations (the 2023.Q3 GDP growth reading was a stark 4.9 percent), while the euro area is muddling along at a much slower clip. Growth in China has been depressed relative to historical standards, and it faces further risks due to its ongoing real estate crisis. Other emerging economies are performing much more strongly, though the current global environment of high interest rates may introduce increasing risk and complicate economic conditions in those countries.
SEPTEMBER 2023
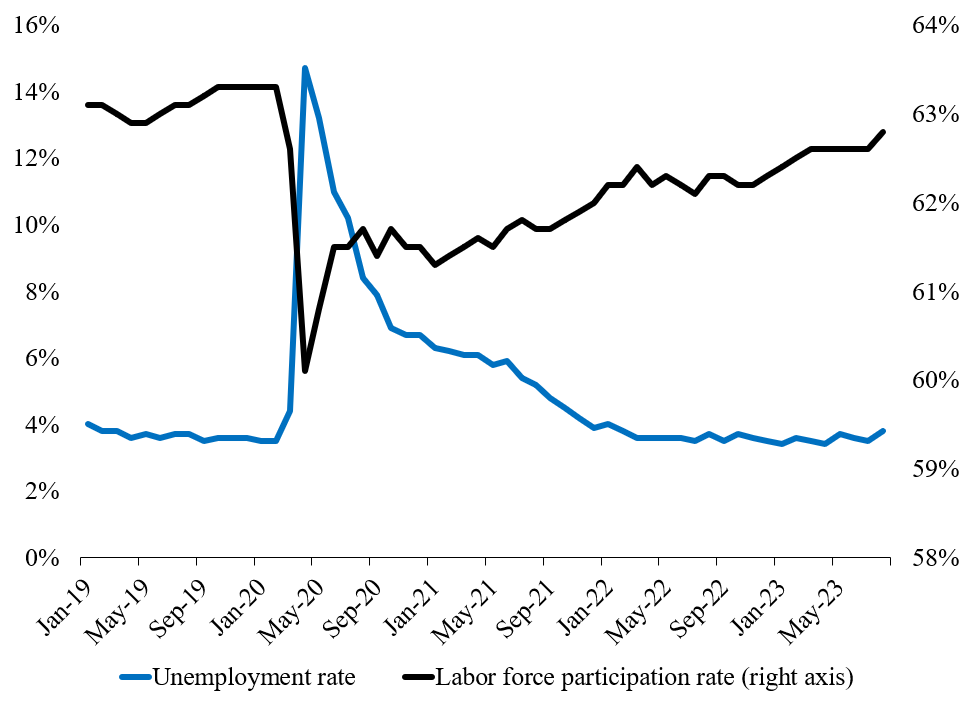
Source: Bureau of Labor Statistics.
Unemployment Rate and Labor Force Participation Both Rise in August
The unemployment rate jumped from 3.5 percent in July to 3.8 percent in August, its highest level since February 2022. The economy added 187,000 jobs in August — relatively modest by recent standards, but above expectations for the month — and estimates for June and July were revised downwards by 110,000 (combined).
While this reflects an expected cooling of the labor market, the unemployment rate increase is also due in part to rising labor force participation. The labor force grew by 736,000, largely due to persons reentering the workforce (i.e. those looking for a job in the past 4 weeks), but also includes those entering the workforce for the first time. This increased the labor force participation rate to 62.8 percent — its highest level since February 2020 — after staying flat since March. Generally, an increase in the labor force tends to increase the numerator (unemployed persons) relative to the denominator (total labor force) in the unemployment rate. Of course, there are other measures of both unemployment and the labor force that provide additional insight into the health of the labor market.
AUGUST 2023

Source: Federal Reserve Board.
Industrial Production Up In July; Likely to Return to Previous Months’ Trend
The index for total industrial production (IP) was up 1.0 percent in July after decreasing in May and June. A large portion of this increase was attributable to utilities, as very high temperatures raised demand for cooling. Manufacturing IP was up 0.5 percent, largely driven by a 5.2 percent increase in production of motor vehicles and parts.
As shown in the figure at left, IP and capacity utilization have gradually approached 2019 levels, albeit unevenly. While manufacturing IP outpaced the total IP index for much of the pandemic-related recovery, those trends have reversed since the middle of 2022. Both total and manufacturing capacity utilization are less than half a percentage point lower than they were in January 2019 — just below historical averages — after peaking around 80 percent in the 2nd or 3rd quarters of last year. Some analysts anticipate that IP will decline again in August, with one analyst citing “weakening goods demand, elevated interest rates, tighter lending standards, inventory destocking, and the strong US dollar.”
JULY 2023
Source: Bureau of Labor Statistics.
Inflation Slows to Lowest Level in More Than Two Years
The all items index increased 3.0 percent for the 12-month period ending in June — the smallest increase since March 2021. For the 12-month period, energy decreased 16.7 percent while food increased 5.7 percent, though food only grew a modest 0.1 percent over the month (driven almost entirely by food away from home). Both the all items and core (excluding food and energy) indexes grew 0.2 percent over the previous month, with the core index monthly increase being the smallest since August 2021. Shelter was the largest contributor to the monthly all items increase, accounting for over 70 percent of the increase.
The June inflation report raised questions over whether the Fed would raise interest rates toward the end of July. Yet, with inflation still above its target rate, it proceeded to hike its key rate by another 25 basis points. Analysts point to real wages outpacing inflation, historically low unemployment, and a very low jobseeker-to-job opening ratio as reasons the Fed is concerned about stubborn inflation in certain areas of the economy.
JUNE 2023
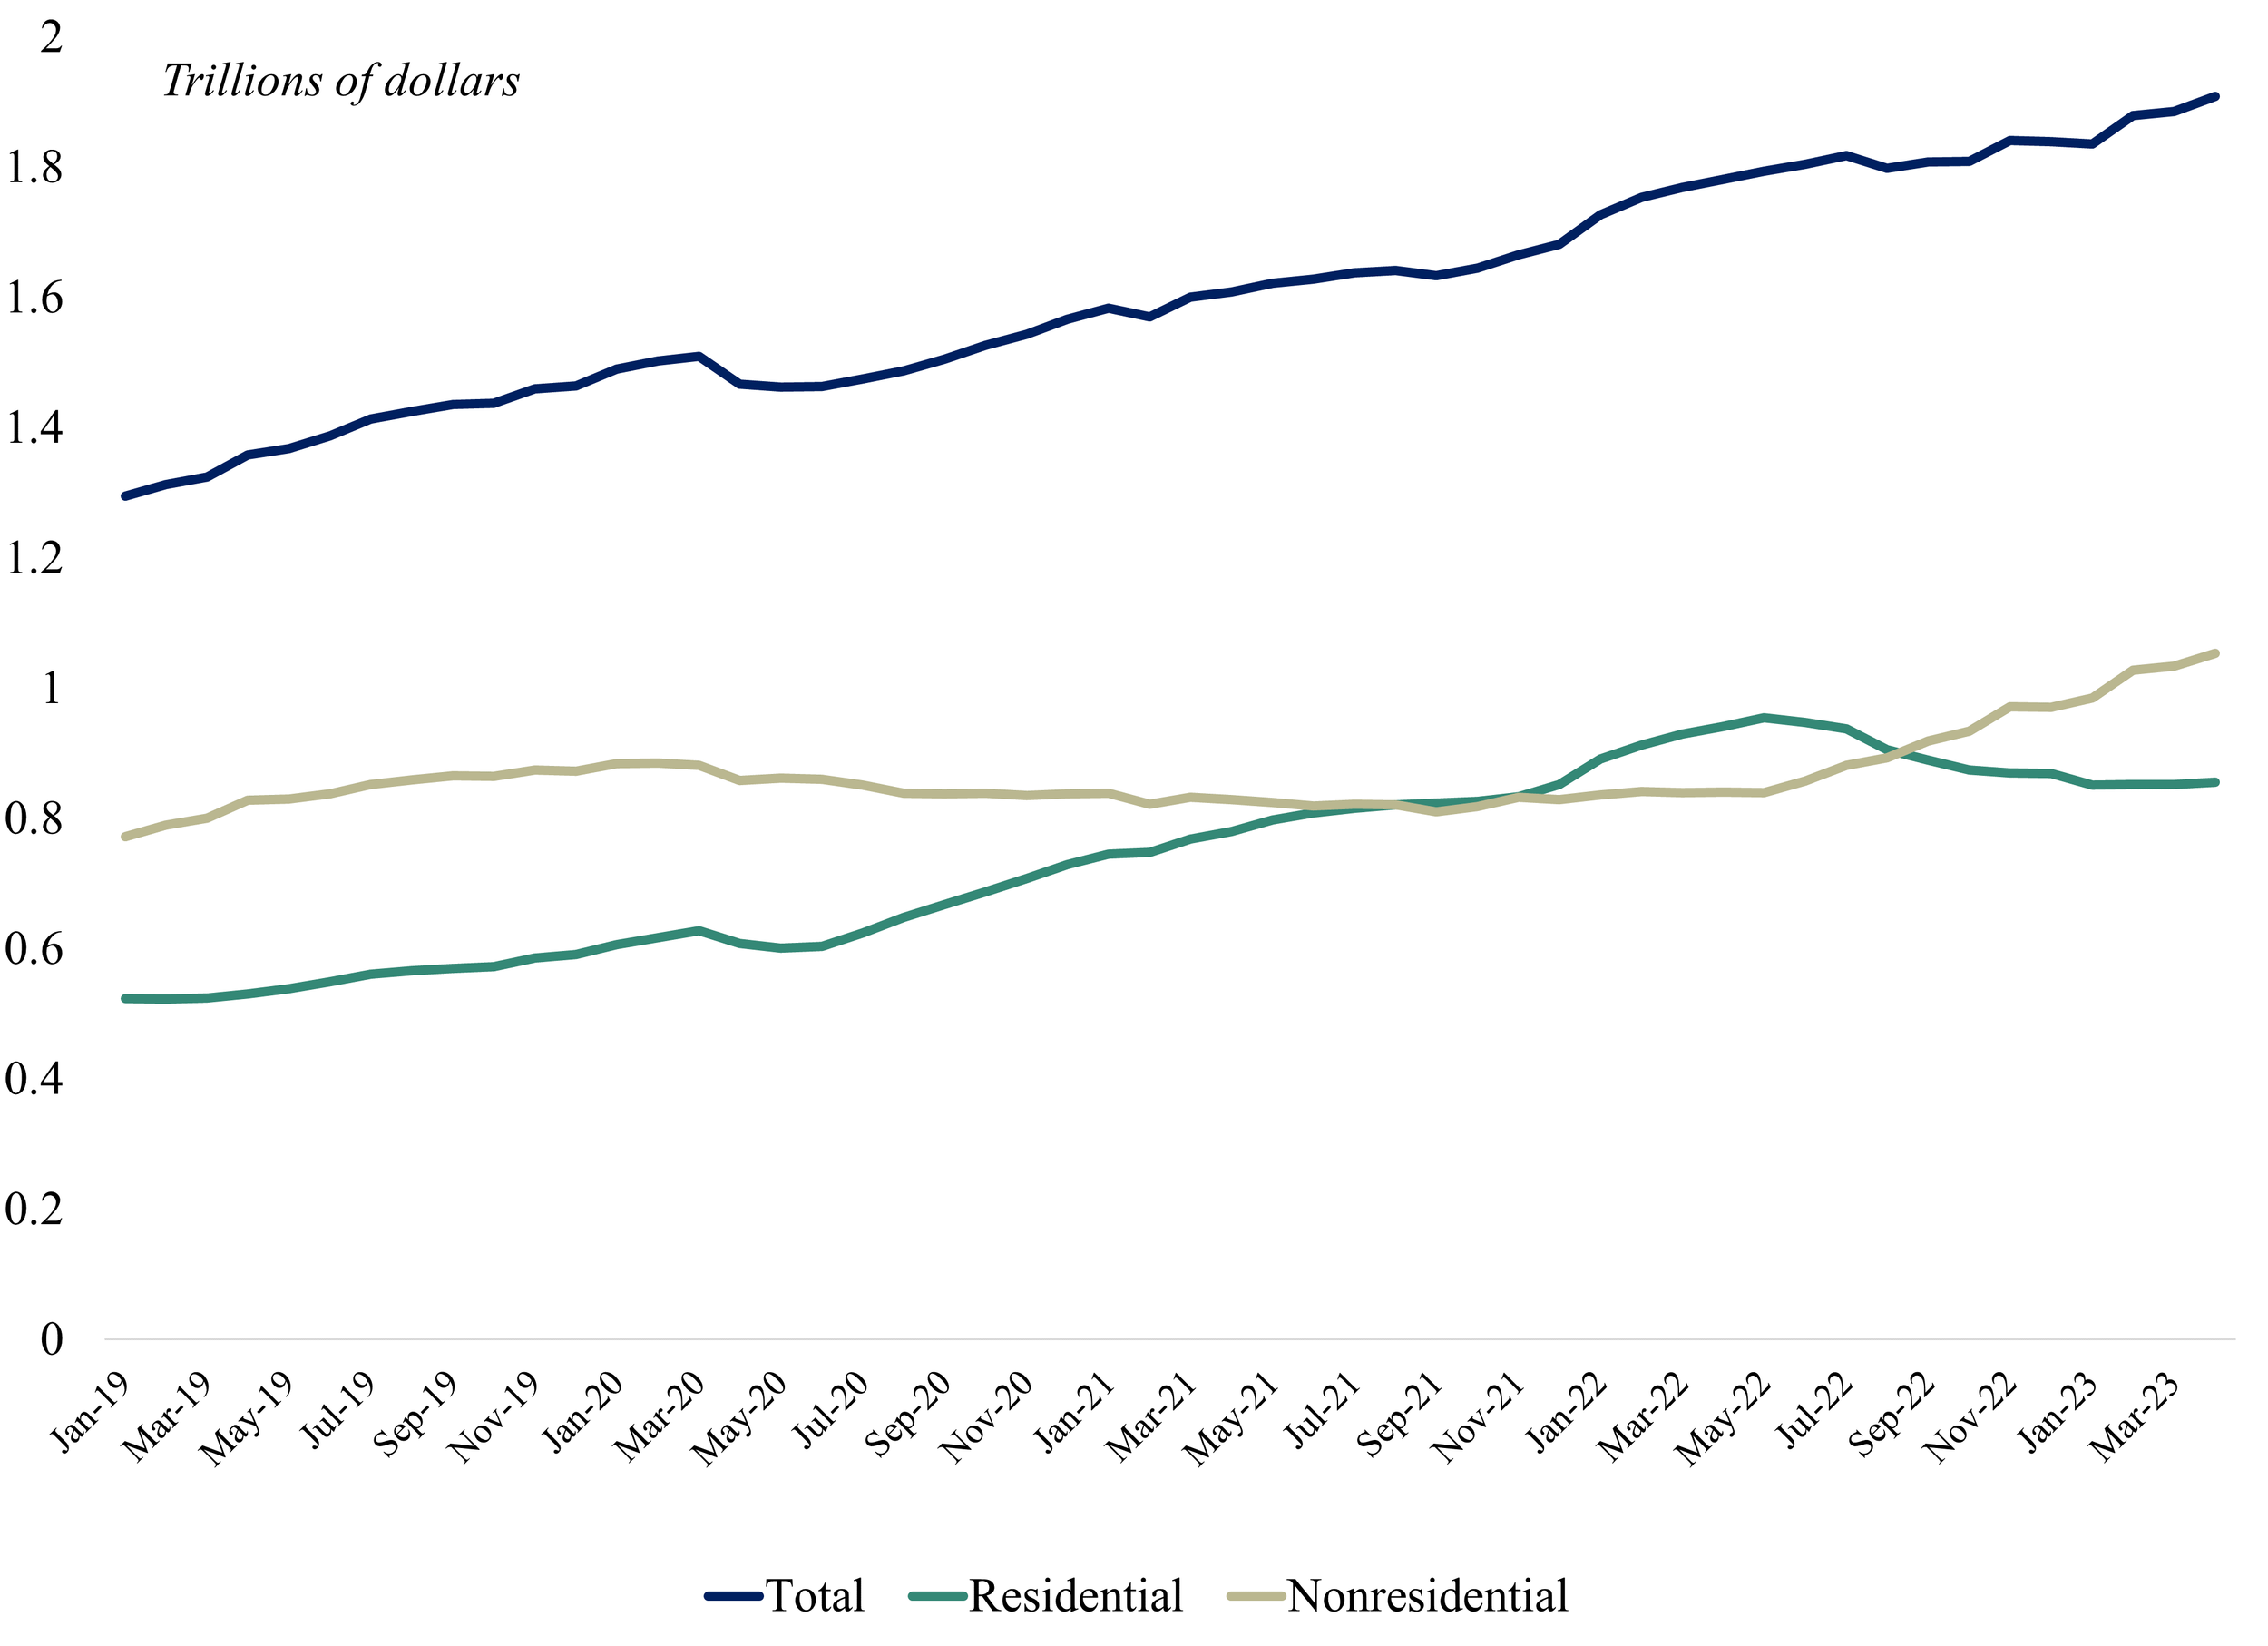
Source: U.S. Census Bureau.
Construction Steadily Continues Upward, With Some Role Reversals
The value of construction put in place has been on the rise since 2019, after being comparatively flatter in preceding years. Following the onset of the pandemic, residential construction surged for nearly 24 months — eventually surpassing nonresidential construction. The combination of remote work and policies that increased savings (among other factors) allowed several younger households to purchase new homes, releasing some of the pent-up demand among millenials that has lingered since the wake of the Great Recession. By May of 2022, around the same time as interest rate increases, residential construction began to slow, while nonresidential construction accelerated and continued to do so through April 2023 — the most recent month for which there are data. However, some of the increases over the period depicted in the chart may be partly attributable to elevated inflation and rising house prices.
MAY 2023
Source: New York Federal Reserve
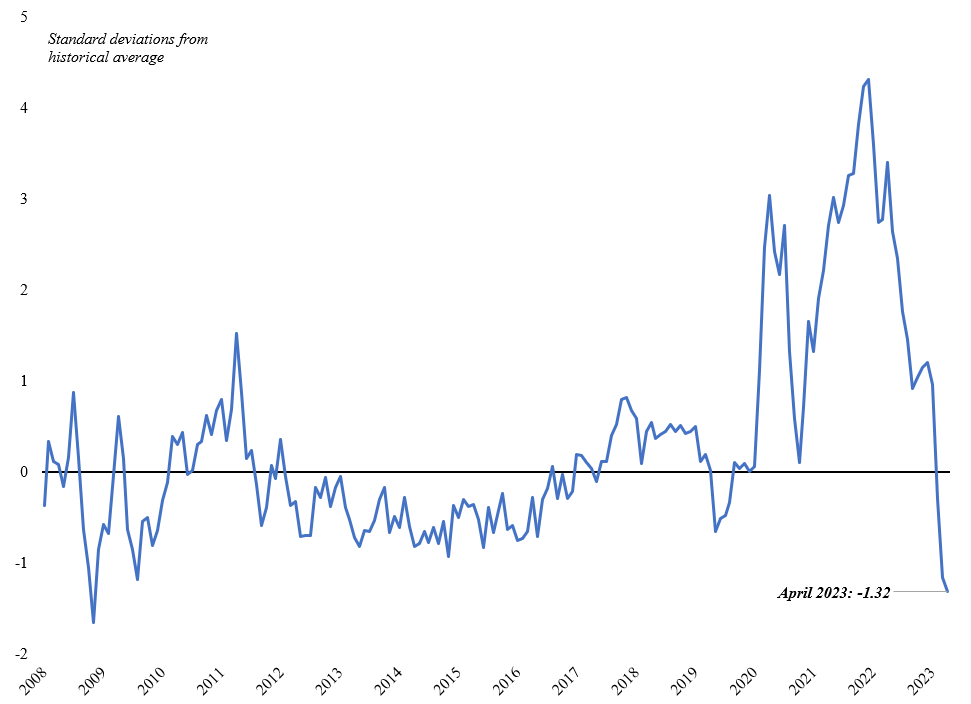
Global Supply Chain Pressures Continue to Fall
Over the last two years, we have explored a variety of factors contributing to supply chain pressures. Typically, those factors are measured from a single angle, such as purchasing mangers’ prices or freight costs, for example. In January 2022, the New York Federal Reserve introduced the Global Supply Chain Pressure Index (GSCPI), a comprehensive index integrating several such measures. The index uses measures from 7 economies: China, the euro area, Japan, South Korea, Taiwan, the United Kingdom, and the United States.
Using data going back to 1997, the GSCPI provides a monthly measure of supply chain pressures in relation to the historical average. Since its peak in December 2021, the index has generally declined sharply and has been below the historical average (which is heavily influenced by the two years following the onset of the pandemic) for three months in a row. The main drivers contributing to the decline in April 2023 to 1.32 standard deviations below the historical average include: Euro Area delivery times, Euro Area stocks of purchases, and Korean delivery times. U.S. import, export, and producer price indices have also continuously declined from their peak in June 2022, reflecting easing supply chain pressures.
APRIL 2023
Wage Growth Appears to Ease Slightly in First Quarter of 2023
While total average wages grew slightly more in March (+0.3% MoM) compared to February (+0.2%), they grew more slowly over the 12-month period — 4.2% over the year compared to 4.6% in February. Particularly in comparison to 2021, wages are generally moderating in most sectors, including leisure and hospitality, where they grew rapidly in that year. Relative to 2019, wages in construction and manufacturing have not grown as quickly as many other sectors. Trade, transportation, and utilities (a category that includes retail) and other service sectors have generally kept pace with total average hourly wage growth. The jobs report including wages and employment also showed an additional 236,000 nonfarm payrolls in March — still quite strong but much more moderate than the previous two months.
MARCH 2023
Source: U.S. Census Bureau
Consumer Imports Reflect Recent Strong Consumer Spending
In last month’s Data Corner, we observed a widening trade deficit at the end of 2022, as consumer spending appeared to remain strong. Over the course of last year, import levels followed varying trends depending on end use. On the business side, imports of industrial supplies peaked in March and mostly moderated the remainder of the year, while capital goods imports were steady. Consumer goods also hit a high point in March and declined for several months, but then picked up sharply in December and again in January of 2023. Imports of autos and auto parts increased sharply in those months as well.
Increased consumer imports in recent months are consistent with recent retail sales and consumer spending reports. These latter trends, in addition to strong performance on other economic indicators and inflation ticking back up in January, prompted Fed Chair Jay Powell to hint at higher-than-anticipated interest rate increases in the coming weeks or months.
FEBRUARY 2023
Source: Bureau of Labor Statistics (import and export totals and indexes); St. Louis Fed FRED (dollar index).
2022 Finishes With Widening U.S. Trade Deficit After Year of Elevated Exports
Like the CPI and PPI, the export and import price indexes (MXP) measure changes in prices of goods shipped abroad or purchased from abroad using customs documentation. Broadly, these indexes allow for analyzing price impacts on trade flows.
As noted in the September 2022 Data Corner post, exports were strong throughout the first half of the year, narrowing the trade deficit. Since then, exports then declined for the remainder of the year, likely driven by the strengthening dollar (in turn driven by rising interest rates) and slowing growth abroad. During the 2nd half of the year, both export and import prices declined, largely a result of declining commodity prices that peaked in the first half of the year.
In the final month of the year, imports picked up even as the dollar slightly eased and import prices ticked upward. While consumers continue to express frustrations with lingering inflation, this provides some evidence of buoyant consumer confidence for the time being.
JANUARY 2023
Source: Organisation for Economic Co-operation and Development. Rate depicted is the 3-month interbank rate.
Global Interest Rates (Mostly) Rise to Tame Inflation Since a Year Ago
Over the past year, central banks around the world have steadily increased short-term interest rates in response to global inflation. However, inflation has been much tamer in a select few countries, including China, which partly explains why (in addition to slowing growth) the People’s Bank of China has lowered rather than increased rates. Compared to the United States and Europe, inflation has also been milder in Japan. Nonetheless, it has exceeded the Bank of Japan’s targets for several months in a row, prompting the central bank to allow 10-year bonds to increase in yield and hinting that their longstanding policy of near-zero rates could be ending in the coming year. The Federal Reserve will meet at the end of this month to decide whether to slow the pace of rate hikes.
DECEMBER 2022
Left axis shown in trillions of current dollars. Source: World Bank, World Development Indicators.
Foreign Direct Investment Rises To Recent Historical Averages
Global foreign direct investment (FDI) outflows and inflows rose to roughly their 10-year average in 2021, after a brief period of subdued levels from 2018-20. The United States saw the largest increase in 2021, amounting to just over half a trillion dollars and making it the top destination for FDI. Other top destinations include the Netherlands, China, Luxembourg, and the United Kingdom.
Several of the leading FDI recipients are relatively small economies in terms of gross domestic product, underscoring the fact that FDI is not necessarily a reflection of productive capacity. While FDI may be used for factories, machinery, and other capital investments, it may also simply reflect intra-firm transactions or financial incentives (e.g. tax benefits) granted by a host country.
NOVEMBER 2022
Graph depicts month-over-month percent changes in index for final demand goods (excludes services). Source: Bureau of Labor Statistics.
Producer Price Index in October Offers Evidence of Slowing Inflation
The producer price index (PPI), like the consumer price index (CPI), is a measure of price changes over time. The PPI differs from the CPI in that it measures prices received by producers rather than those paid by consumers, and therefore it reflects wholesale prices and a somewhat different basket of goods and services.
For final goods and services combined, the index was up 0.2 percent in October over the previous month — slightly below expectations . It was up 8.0 percent over the year. The index for final demand goods was up 0.6 percent on the month, mainly driven by gasoline. Excluding food and energy, the goods index decreased 0.1 percent. The index for final demand services (not depicted at left) was also down 0.1 percent.
The PPI also measures prices for intermediate goods and services. Intermediate goods indexes — for both processed and unprocessed goods — were each down for the month due to several decreases in prices of inputs. The intermediate services index was up 0.3 percent, driven in large part by increasing costs for business loans.
OCTOBER 2022
Source: International Monetary Fund, World Economic Outlook (October 2022)
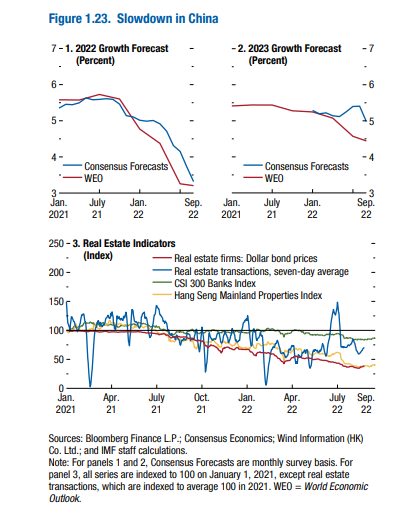
China Slowdown One of Several Risks Facing Global Economy
The International Monetary Fund released its biannual World Economic Outlook report this month, which offers a detailed forecast for the global economy. Its outlook over the next two years appears troublesome, with numerous causes for concern. Among them are persistent inflation in both advanced and emerging economies, rising public debt and borrowing costs (made worse for developing nations in the case of a strengthening dollar), the war in Ukraine, and potentially widespread economic slowdowns — exacerbated in part by the need for central banks to tighten monetary policy.
In addition to recent pandemic-induced shutdowns, China’s slowdown has a unique structural component. At roughly one-fifth of GDP, China’s real estate market has historically been a significant driver for growth. Heavily indebted developers, delayed and unfinished projects, declining prices and sales, and mortgage payment strikes have undermined confidence in the sector — in which a substantial portion of Chinese household wealth is held. A severe and protracted adjustment in China’s real estate market could have reverberations beyond its own financial system, particularly for emerging economies.
SEPTEMBER 2022
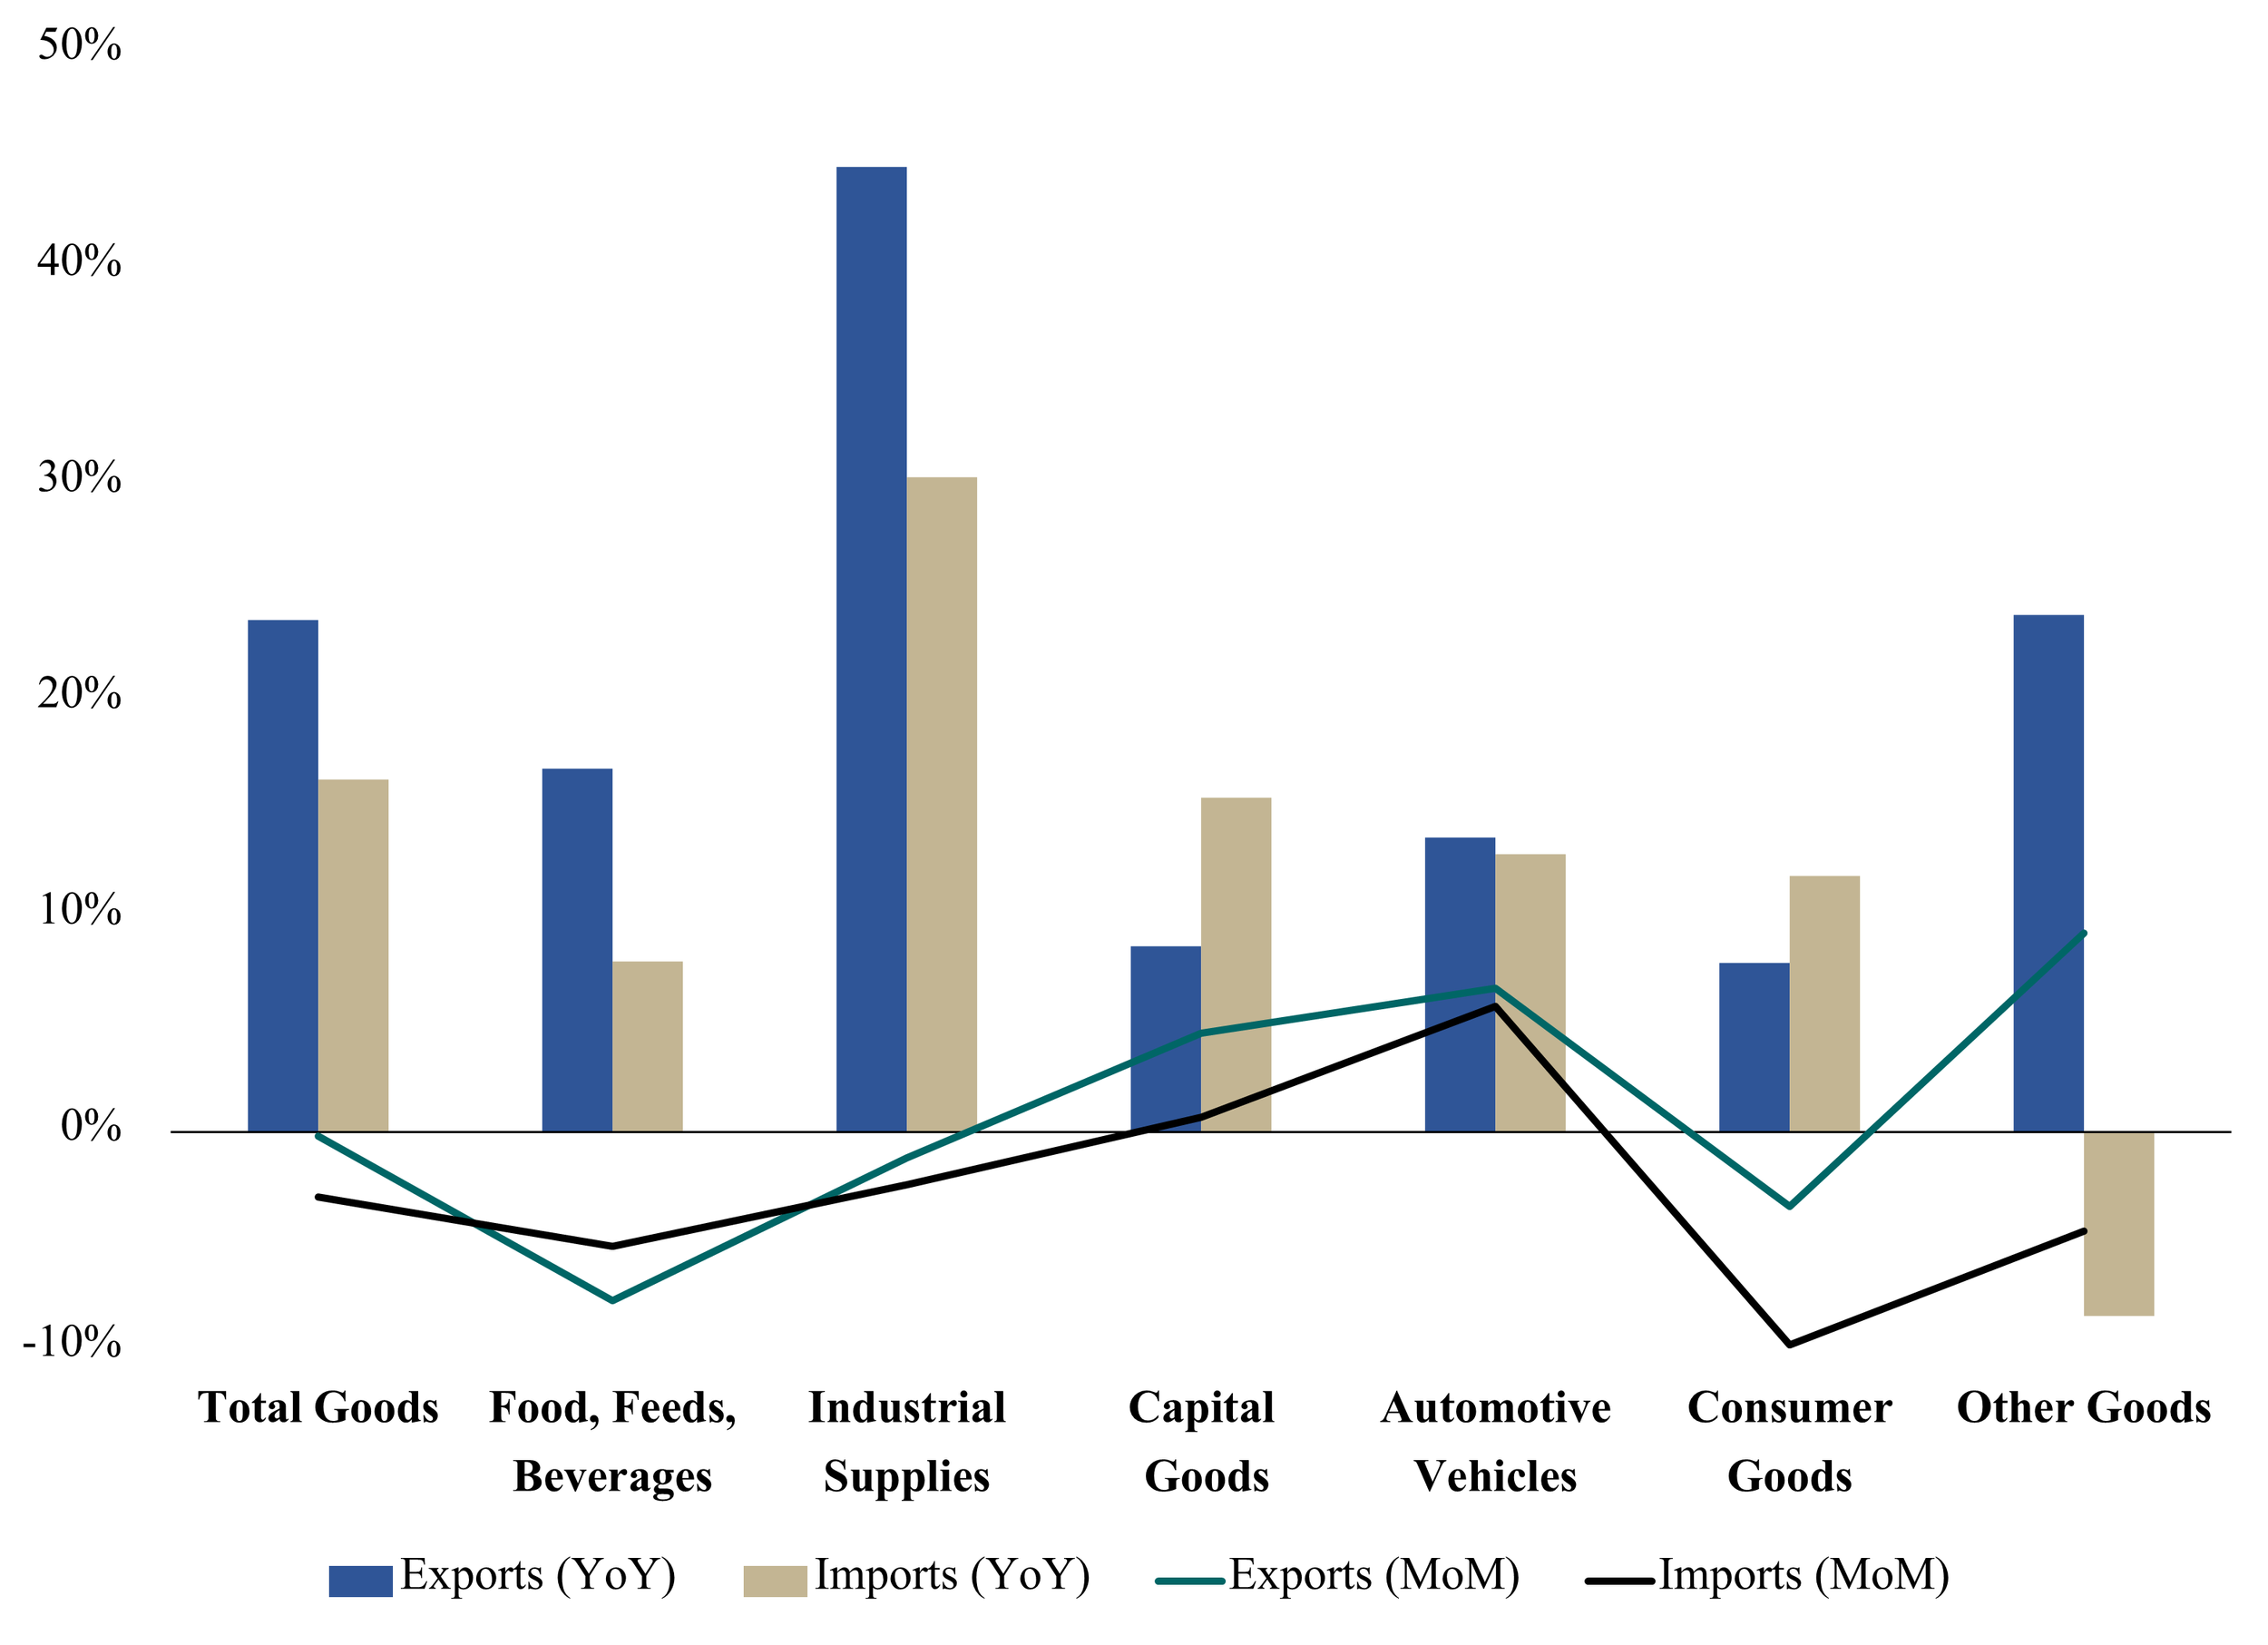
Source: Bureau of Economic Analysis and U.S. Census Bureau. Figures shown in year-over-year (YoY) and month-over-month (MoM) percent changes for July 2022. Figure depicts trade in goods only (excludes services).
U.S. Trade Deficit Down From June to July; Still Up From Last Year
The trade in goods and services deficit was $70.6 billion in July, down from $80.9 billion in June. A decrease in the goods deficit (-$8.2 billion) and increase in the services surplus (+$2.1 billion) drove the changes. After peaking in March ($106.9 billion), the goods and services deficit is nearly the same it was in July 2021. Yet, overall trade was much greater than in July 2021, with exports up 21.1 percent (23.7 percent for goods alone) and imports up 16.7 percent.
The general increase in trade from last year is largely attributable to easing supply chain snarls. Some categories are also influenced by geopolitical factors, such as increased petroleum and other energy production in the U.S. and abroad, as reflected in the increase in industrial supplies trade (shown in chart at left).
AUGUST 2022

Source: Bureau of Labor Statistics.
Employment Gains Far Exceed Expectations in July
U.S. nonfarm payroll employment increased by 528,000 jobs last month — a positive surprise, given fears of a potential looming recession. Service-providing sectors led overall gains, particularly in leisure and hospitality, professional and business services, and health care. Other sectors saw noteworthy gains as well, including construction, manufacturing, and retail.
The July report marks the return of total nonfarm employment and the unemployment rate (at 3.5 percent) to their February 2020 pre-pandemic levels, albeit with little change over the month for several demographic groups. The labor force participation rate and employment-to-population ratio still remain below February 2020 levels.
JULY 2022
All figures shown in percent; seasonally adjusted. Source: U.S. Census Bureau
Shipments, Inventories, and Orders of Manufactured Goods Up Again In May
Shipments, inventories, and orders of manufactured goods increased from April to May, as they have in each category for several months recently. New orders were up 1.6 percent, with durable goods up 1.4 percent, indicating demand for products is still strong. Transportation equipment led the increase in new orders, unfilled orders, and shipments of durable goods. Petroleum and coal products led the increase in shipments and inventories of nondurable goods. Machinery was the largest factor contributing to the increase in inventories of durable goods. The unfilled orders-to-shipments ratio was down slightly from April, while inventories-to-shipments remained unchanged.
JUNE 2022
All figures shown in percent; seasonally adjusted. Source: Bureau of Labor Statistics.
Inflation Remains Persistently High
The Consumer Price Index (CPI) rose 1.0 percent in May over the previous month and 8.6 percent since last year — the largest increase since December 1981. The largest drivers of the increase were shelter, gasoline, and food. Core CPI, excluding food and energy, rose 0.6 percent month-over-month (the same as in April) and 6.0 percent year-over-year. The largest contributors excluding food and energy were shelter, airline fares, used cars and trucks, and new vehicles. In response, the Federal Reserve raised interest rates by 75 basis points this month, with continued substantial rate hikes expected in July and following months.
MAY 2022
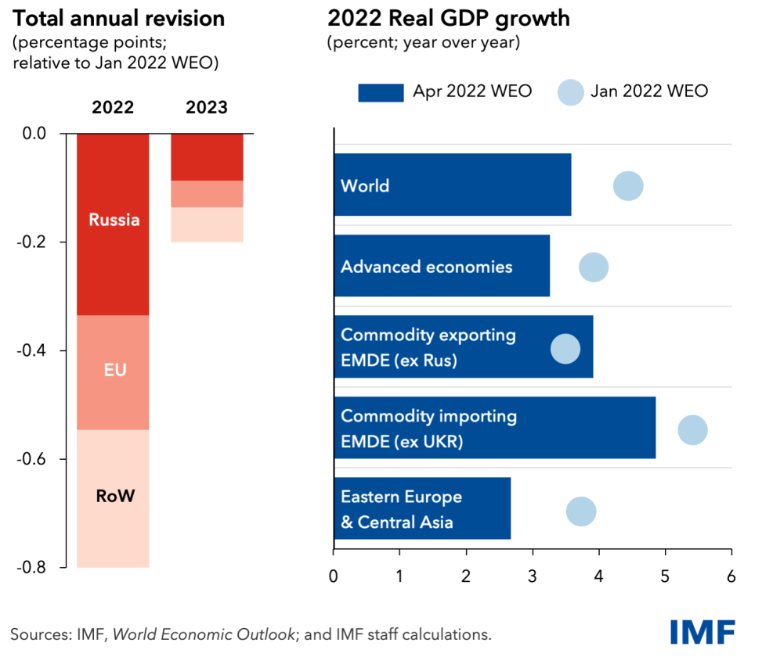
Global Growth Forecasts Revised Downward, Largely Due to Invasion of Ukraine
In April, both the International Monetary Fund and World Bank reduced their January 2022 global growth forecasts by more than a percentage point, to 3.6 percent and 3.2 percent, respectively. The Ukraine invasion is adding to supply chain disruptions and causing shortages for commodities such as oil and food, further contributing to inflation risks. Additionally, these disruptions are compounded by ongoing lockdowns in China. While the war in Ukraine has global effects, it is making an already uneven recovery more difficult on many developing economies.
APRIL 2022
Data excludes services. Source: UNCTAD
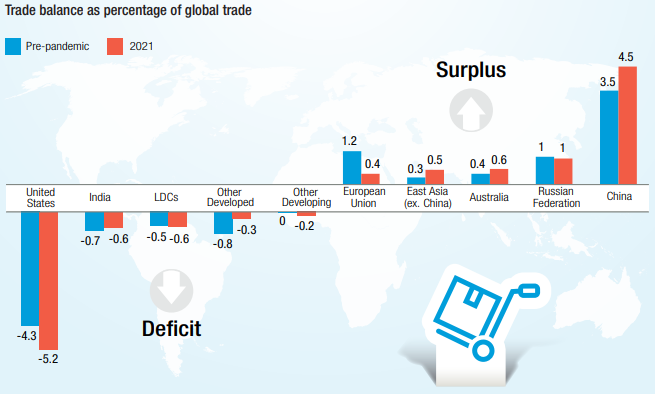
Global Trade Reaches Record High in 2021, Some Imbalances Grow
Global trade reached a record high of about $28.5 trillion in 2021— roughly 13 percent higher than pre-pandemic levels. It accelerated particularly strongly in the last quarter of 2021 but is expected to slow in 2022. Along with this growth in trade, the United States’ deficit and China’s surplus also grew.
Developing countries’ trade outpaced that of developed countries during this period. The war in Ukraine is currently causing price spikes in certain food and commodities that will continue to cause shortages and disrupt trade patterns, which may acutely affect less developed economies.
MARCH 2022
Left axis in millions; seasonally adjusted, total nonfarm
Source: Bureau of Labor Statistics
Employment and Wages Increase, Job Openings Remain High
The U.S. labor market made strong employment gains in February 2022, and wages ticked upward after strong continued growth through 2021. Labor force participation also ticked upwards in February. Yet, nonfarm payrolls were still just below their February 2020 level (-1.4%).
Meanwhile, job openings remained high at 11.3 million, and separations (e.g. quits and layoffs) and hires both edged upwards in January 2022. Updated Job Openings and Labor Turnover Survey (JOLTS) data reflecting February trends will be available March 29. Employment and earnings data will be available April 1.
FEBRUARY 2022
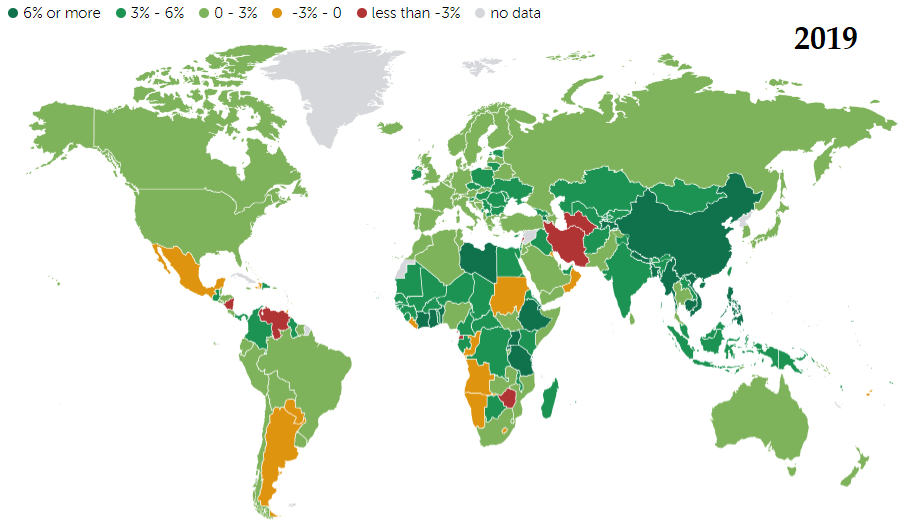
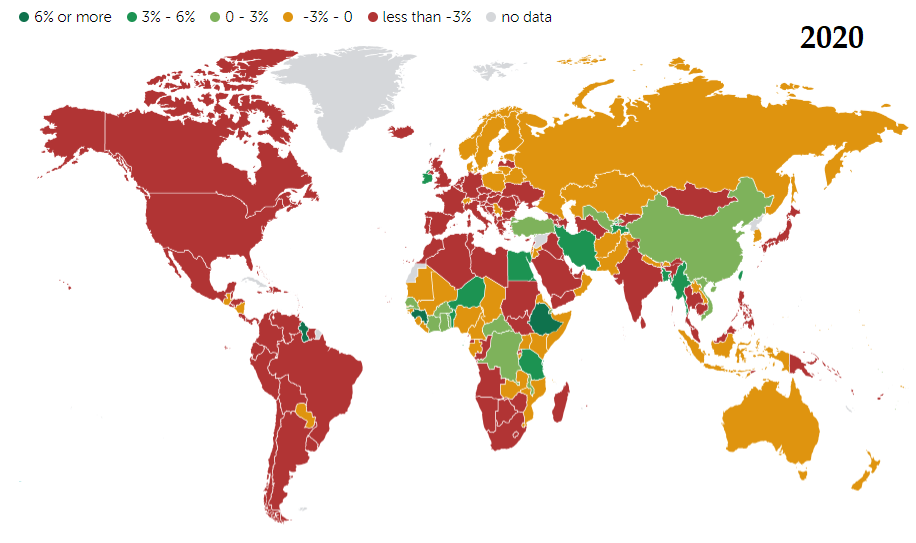
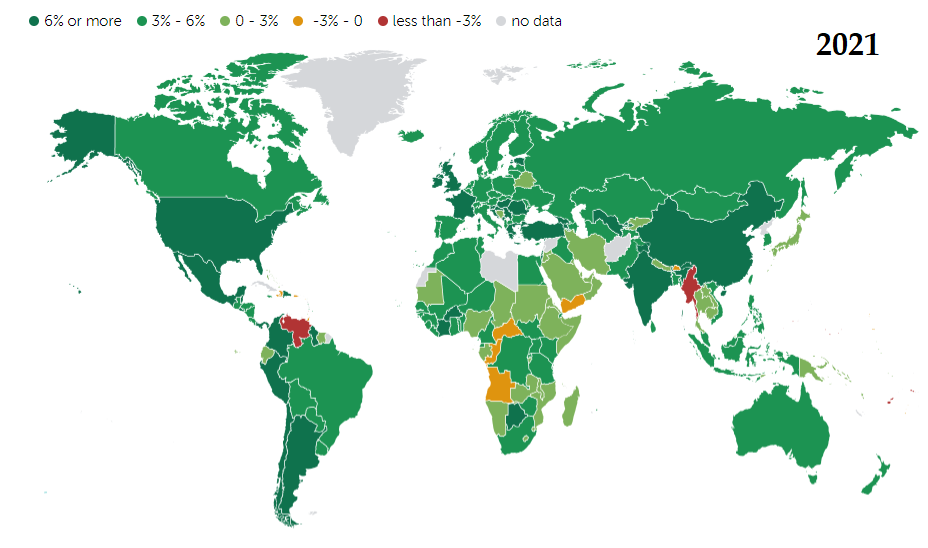
Real GDP Rebounds Globally in 2021
Most nations posted strong real GDP growth in 2021, due in large part to rebounding from deep contractions or slowed growth in 2020. According to the Bureau of Economic Analysis, whose methodology differs slightly from that of the IMF (depicted in the visualizations below), it was the strongest growth rate for the U.S. since 1984, at 5.7%. Real GDP growth rates in 2022 depend on factors that have persisted in the global economic environment through all or most of 2021. Namely, the ongoing pandemic, supply bottlenecks, and high inflation are likely to cause economic headwinds globally. Yet, the severity of each of these obstacles has the potential to subside throughout the course of the year. The IMF’s interactive map, accessible by clicking the button below, includes more historical data as well as forecasts.
JANUARY 2022
Nov. 2019=100; Not seasonally adjusted Source: Bureau of Labor Statistics
Changes in Terms of Trade
The Bureau of Labor Statistics publishes a monthly index measuring the U.S. terms of trade (“TOT”) with select trading partners and regions. This measure reflects the ratio of export prices to import prices with a particular trading partner, which is an indicator of relative U.S. purchasing power. The index can be used to observe changes from one period to another, but the indexes themselves cannot be compared with one another. With the exception of Canada, the U.S. TOT with the select trading partners depicted in the chart modestly improved last year. The U.S. TOT is correlated with the strength of the U.S. dollar, which appeared in last month’s Data Corner.
DECEMBER 2021
Oct. 2019=100; Not Seasonally Adjusted Source: St. Louis Fed, FRED
The Dollar Regains Strength
The dollar has appreciated modestly in recent months. The graph to the left depicts the Federal Reserve’s Nominal Broad U.S. Dollar Index — a trade-weighted index of the dollar relative to foreign currencies. In last month’s Data Corner, we saw a recovery of global merchandise trade, with a much speedier increase in U.S. imports compared to exports. A strengthening dollar tends to exacerbate that trend, as U.S. dollars can purchase more foreign goods than before, while U.S. goods (and services) become more expensive abroad. Of course, numerous other factors influence trade flows, such as monetary and fiscal policy, supply constraints, and relative GDP growth rates, for example.
NOVEMBER 2021
Q1.2017=100; Not Seasonally Adjusted Source: WTO Stats
Recovery of Merchandise Trade
The WTO Merchandise Trade Index — based on volumes of trade in agricultural products, fuels and mining products, and manufactures — reflects a robust recovery in global trade volumes following the depth of the pandemic. In comparison to Q2.2019, global exports were up 2.8 percent in Q2.2021. U.S. imports were 5.6 percent higher, while U.S. exports were 3.8 percent lower — the same level as Q2.2017. These most recent data follow the WTO’s analysis of goods trade in Q1.2021, which accelerated faster than any previous period.
OCTOBER 2021
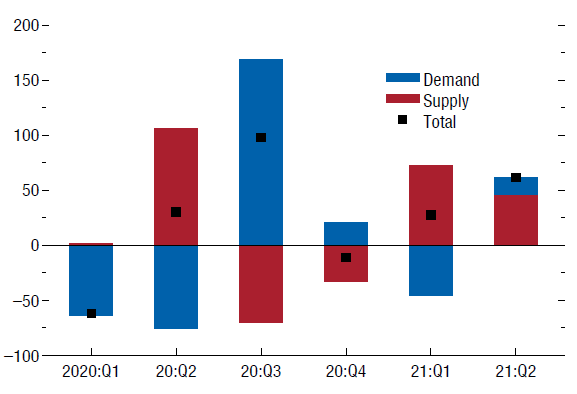
Supply and Demand Drivers of Shipping Expenditure Growth
In contrast to the 2nd half of 2020, supply factors were the main causes of upward pressure on shipping expenditures in the 1st half of 2021. The IMF analysis at left uses 20 variables to decompose causality, with the left axis showing percent changes. Important contributors to supply side pressure include: shortages of production inputs (such as semiconductors), a shortage and uneven distribution of shipping containers, and disruptions at major ports. Examples of such disruptions in 2021 include the Suez Canal blockage , coronavirus restrictions in China’s Pearl River Delta, and congestion at the ports of Los Angeles and Long Beach.
Source: IMF World Economic Outlook (October 2021)