China Targets Key U.S. Industries in Retaliation to Sections 232 & 301
Escalating trade tensions between the United States and China have resulted in multiple actions that threaten to significantly alter trade flows between the world’s two largest national economies. The Trump administration has released two lists of products for which it intends to impose tariffs on imports from China. The first list is based on the Commerce Department’s Section 232 investigation, covering $2.8 billion in imports from China. The second list, based on the U.S. Trade Representative’s Section 301 investigation, covers $49.8 billion. China has responded to each of these lists with a retaliatory list covering a comparable value of its imports from the United States. The U.S. Section 232 tariffs and China’s subsequent retaliation tariffs are already in effect. However, the larger Section 301 tariff lists are not yet in effect and both sides have left some room for negotiation and possible de-escalation. This post summarizes the actions taken so far and focuses on the choices made by Chinese trade officials in selecting which products to target for tariffs.
U.S. Actions and China’s Retaliations
On March 1, the Trump administration announced global tariffs of 25 percent on certain steel products and 10 percent on certain aluminum products. The tariffs were a result of the Commerce Department’s Section 232 Investigation, a rarely-used section of the trade laws ostensibly focused on the effects of imports on U.S. national security. Some major U.S. trade partners, including the European Union, Canada, and Mexico, received temporary exemptions from these tariffs, pending further negotiation. However, no exemptions were made for China when the tariffs went into effect on March 23.
In response, China announced tariffs of 15-25 percent on 128 U.S. export products, including certain pork products, fruits, nuts, aluminum scrap, and others. These tariffs went into effect on April 2 and cover products that accounted for nearly $3 billion of China’s U.S. imports in 2017.[1] The table below lists the products covered by the tariffs, grouped into broad (unofficial) categories.[2]
Products Targeted by China for 15-25% Tariffs in Response to Section 232
[table id=51 /]
Source: Retaliation list from China’s Ministry of Commerce (in Chinese), March 26, 2018. 2017 U.S. export values from US Census Bureau: USA Trade Online (State Exports: Origin of Movement). Note that the product categories are not official, but broadly grouped for the sake of simplicity. The tariffs are not necessarily comprehensive of all products within these categories.
While the Section 232 Retaliation tariffs may have a large impact on the particular industries involved, $3 billion is a small share of China’s total imports from the United States (roughly two percent, according to China’s trade reporting). Likewise, the Trump administration’s Section 232 action targeted only $2.8 billion of U.S. imports from China, or roughly half of a percent of the total. The relatively small coverage of Chinese steel and aluminum products is due to the fact that many Chinese steel exports are already covered by anti-dumping or countervailing duties in the United States. Though the Section 232 investigation was in large part a response to over-capacity in China’s steel and aluminum industries, the objective was never to cover a significant share of U.S. imports from China.
By contrast, the Trump administration’s Section 301 investigation, running in parallel to the Section 232, was entirely focused on China. The Section 301 action was self-initiated by the U.S. Trade Representative (USTR) and investigated “the government of China’s acts, policies, and practices related to technology transfer, intellectual property, and innovation.” The USTR’s report, released March 22, found that these Chinese policies “result in harm to the U.S. economy of at least $50 billion per year.” Following the report’s release, the Trump administration announced a list of 1,333 Chinese products, mostly machinery and intermediate goods used in U.S. supply chains, that will be considered for a 25 percent tariff. These tariffs have not yet gone into effect and await further deliberation, including a public hearing to be held May 15.
In response to the Section 301 announcement, on April 4, the government of China announced a list of 106 products covering $48.8 billion in imports from the United States that would face a 25 percent tariff if the Trump administration enacts the Section 301 tariffs. These products are listed below, again grouped in broad (unofficial) categories.
Products Targeted by China for 25% Tariffs in Response to Section 301
**Table 52**
Source: Retaliation list from China’s Ministry of Commerce (in Chinese), April 4, 2018. 2017 U.S. export values from US Census Bureau: USA Trade Online (State Exports: Origin of Movement). Note that the product categories are not official, but broadly grouped for the sake of simplicity. The tariffs are not necessarily comprehensive of all products within these categories.
As shown in the export values above, China’s Section 301 Retaliation list covers a much larger value of U.S. exports, affecting industries at the core of the American economy. In particular, the aircraft, automobile, and soybean industries are huge sources of U.S. exports and are broadly distributed throughout the country. Were China’s Section 301 tariff list to go into effect, there would be a significant impact on U.S. manufacturing and especially agriculture.
Finally, in response to China’s retaliation to the Section 301, President Trump himself recommended further retaliatory action that would expand the Section 301 to cover an additional $100 billion of imports from China. It is unclear which products would be covered by these additional tariffs and when (or if) they will be announced. The government of China has not formally responded to the president’s suggestion.
(For more on the timing and specifics of these trade matters, see this handy infographic from the Peterson Institute for International Economics.)
China’s Tariff Targets: Which Industries and Why?
The remainder of this post focuses on Beijing’s choice of which products to target with tariffs. Both the Section 232 Retaliation list (already in effect) and the Section 301 Retaliation (pending U.S. action on Section 301) are included in the analysis below
Combined, the products on China’s retaliation lists accounted for $51.8 billion, or roughly a third of China’s imports from the United States in 2017. These products were not chosen at random but represent China’s assessment of which U.S. industries would be sensitive to tariffs, either in an economic or political sense. In general, the goal of a retaliatory trade action is to bring significant pressure on your adversary without causing too much pain at home. The best way to thread that needle is to place tariffs on a product for which you can find alternative sources of supply but one’s adversary will have trouble finding alternative markets, creating a negative demand shock across the entire industry (i.e., lower prices, lower sales, or both). All the better if that industry is politically influential in the adversary country. For example, soybeans are commodity products and China can find ample alternative supply outside the United States. Soybean production is an important industry in many regions of the United States, including in states of particular importance to U.S. elections, as discussed below. Similarly, the aircraft and automobile industries are each a major source of quality jobs in many parts of the country and Beijing naturally assumes that these industries are influential in Washington.
Caveat: It is possible to go too far reading into China’s product choices. As pointed out in a recent Planet Money podcast, some product codes were clearly selected as filler, as they represent products, such as durian fruit, for which the U.S. had no exports to China. Further, the objective of both Chinese retaliation lists was to mirror the trade value of the original U.S. action, which means that some products may have been chosen simply to make the numbers match.
That being said, the choice of products provides insights into Chinese trade officials’ assessment of U.S. political economy. To assess the geographic distributional impact of the proposed tariffs, we employ data from the US Census Bureau on state-level exports based on “origin of movement” that identifies the origin state of products exports from the United States. These data come with some significant caveats that we address in the footnotes.[3]
The map below displays U.S. states by the value of their exports to China (states in red had the highest value of exports to China in 2017 and states in green had the least). Scroll over a state to see the value of its 2017 exports and all product categories for which it exported at least $10 million of goods to China, listed in descending order of value.
Value of U.S. Exports to China Targeted for Retaliation, 2017

Source: Retaliation lists from China’s Ministry of Commerce (in Chinese), March 26, 2018 (in response to U.S. Section 232 action) and April 4, 2018 (in response to U.S. Section 301 action). 2017 U.S. export values from US Census Bureau: USA Trade Online, State Exports (Origin of Movement).[3]
The map demonstrates that the selected products are concentrated in the Midwest, South, and Pacific states. The disproportionate impact on the South and Midwest is a function of the large volume of agricultural and final manufactured goods produced in these regions. These are products that Beijing knows it can acquire from other countries, unlike the intermediate manufactured goods (such as electronics or machinery) that China requires to supply its own manufacturing base. These choices also reflect political calculations. These states represent either a) core Republican constituencies that China might hope will bring pressure on the Trump administration or b) key swing states or districts of particular concern to the Republican party. Election forecasters believe these regions will be critical to the outcome of the 2018 midterm elections.
The impact of Chinese tariffs on the Pacific states is inevitable for geographic reasons. Forty percent of U.S. exports to China embark from ports in California, Oregon, and Washington and export-oriented industries naturally concentrate on the West Coast for their Asian export operations.[4] However, several products on China’s retaliation list appear to be specifically targeted at these states. Almonds, cherries, grapes, and wine are all predominantly (if not exclusively) produced in California and Washington. While the West Coast states typically elect Democrats in state-wide elections, the relatively Republican areas of inland California are 2018 election battlegrounds and produce a large share of U.S. fruits, vegetables, and nuts.
The analysis above should not overstate the importance of geographic origin. In many cases, the tariffs target commodity products that, as an economic matter, should impact all U.S. producers of the goods, whether or not a particular producer happens to sell its products to China. For example, in 2017 Iowa exported “only” $31 million in soybeans and $42 million in pork products to China. These exports represent a very small share of the $5.2 billion of soybeans and $6.8 billion of pork produced in Iowa overall. However, this fact comes as little solace to the soybean and pork farmers in the Hawkeye State. Soybean and pork futures collapsed in commodity markets following the tariff announcements and the tariffs will place downward pressure on prices for all U.S. producers, even if they sell none of their products to China. This fact should be kept in mind when considering the high value of exports for the Pacific states in the map above. For commodity products facing a nation-wide demand shock, the Origin of Movement data overstate the impact on the West Coast and understate the impact elsewhere.
Most products on China’s lists are geographically-concentrated industries in the United States. For 18 of the 20 product categories listed above, the top five states accounted for at least 75 percent of total U.S. exports to China, according to the Origin of Movement data. One exception is scrap aluminum, which accounted for nearly half of the value of total U.S. exports to China covered by the Section 232 Retaliation tariffs. Twenty-five states exported at least $10 million worth of scrap aluminum to China and China was the largest destination for this product in the vast majority of states.
The Politics of U.S. Agricultural Exports
By value, more than a third of China’s retaliatory tariffs target U.S. agricultural exports. Agriculture in the United States overwhelmingly takes place in Congressional districts currently represented by Republicans. According to the most recent agricultural census, 84.4 percent of total U.S. farm acreage is in districts that elected a Republican to the House in 2016, while only 15.6 percent is in Democratic districts.
[5] The breakdown is similar for corn (82% Republican), cotton (82%), hogs (84%), soybeans (83%), and wheat (95%).[6] Agricultural tariffs are therefore a natural choice for Chinese officials that seek to get the attention of Republicans who control the White House and both houses of Congress. The figure below depicts Congressional districts’ share of U.S. agricultural production (by value), broken out by Trump’s share of the 2016 vote in that district. Sixty-six percent of U.S. agricultural production occurs in Congressional districts that Trump won by at least ten points. Only 15 percent occurs in districts that Hillary Clinton won by at least ten points. Competitive districts account for just 20 percent of all agricultural production.
Value of Agricultural Production (% of U.S. Total) of U.S. Congressional Districts,
by Trump’s Share of 2016 Vote
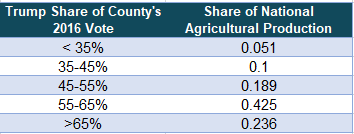
Source: 2016 U.S. Presidential Election results: Daily Kos Elections, “Daily Kos Elections’ presidential results by congressional district for 2016, 2012, and 2008,” updated February 2018. Value of U.S. agricultural production: USDA Census of Agriculture, 2012 Census Publication, Congressional District Profiles.
Within agriculture, the particular products targeted for tariffs appear to be politically sensitive, especially soybeans. Six of the ten largest soybean producing states have Senate races this November, including Minnesota which has two Senate races. There is also good reason to believe that these races will be competitive. In the 2016 presidential elections, there were six states decided by less than two percentage points. These states produce 15 percent of U.S. soybeans and, if you include Iowa (which Obama won twice but elected Trump), these competitive states produced more than 27 percent of U.S. soybeans.
U.S. pork production follows a similar pattern, concentrated in the Midwest and a handful of other states. 50 percent of U.S. hog sales occur in Iowa, North Carolina, and Minnesota, each of which was considered competitive in the 2016 election. Like soybeans, major pork-producing states will be impacted by Chinese tariffs to a degree not reflected in the state-level origin of movement data. For example, China accounted for only 6 percent of Minnesota’s pork exports, but farmers there have acknowledged that the tariffs will mean lower prices on all of their sales – not just their sales to China.
In sum, soybeans and pork are not only overwhelmingly produced in Republican areas, but these districts and states are likely to be competitive in coming elections. Given that soybeans and pork are readily available from alternative suppliers outside the United States, these products are a natural choice for Chinese trade officials in selecting tariff targets.
Conclusion
The United States and China are large economies that are significant exporters to the world and to each other. The two countries are also linked through bilateral investments. These links ensure that China’s decision to more-or-less match the administration’s proposed tariffs is potentially a big deal to U.S. producers who export to China. This blog used multiple data sets to demonstrate that China’s targets for retaliation are largely geared toward high-value products as well as products that are produced or grown in states that are politically sensitive. Agricultural products, which tend to be grown or raised in states that voted for President Trump, are disproportionately targeted. Only time will tell if the announced tariffs have political as well as economic ramifications.
Notes
[1] China’s import data from GTIS Global Trade Atlas for products listed in the Ministry of Commerce’s retaliation announcements on March 26 and April 4.
[2] Note that these category descriptions are unofficial and used for simplicity. China’s tariffs have been placed on products at the eight-digit level of the Chinese system, which do not lend themselves to straightforward discussion.
[3] Caveats for Interpreting U.S. state-level Origin of Movement export data. First, U.S. export codes can only be mapped to Chinese import codes at the six-digit level, but China’s tariff are imposed at the eight-digit level in the Chinese tariff system. This means that U.S. export data overstate the value of trade because the categories include products not covered by the Chinese tariffs. In the aggregate, this is not a huge difference: U.S. six-digit export values of the covered products overstate Chinese eight-digit import values by only 0.7 percent. However, the differences could be significant for a particular product/state.
The origin of movement (OM) data should be interpreted with care. The OM series is based on information supplied by U.S. exporters on official Shippers Export Declarations for goods leaving the United States. There are many cases when the state origin of movement and the state of production happen to be the same; however, the OM series is based on transportation origin, not production origin. Thus, in many case, the origin of movement data will capture the export from distributors/intermediaries located in states different from the state of production. For example, the OM data suggest that soybeans are a major export product for the state of Washington, though Washington produces no soybeans. This is likely a result of soybeans grown elsewhere being stored in Washington, perhaps with some amount of processing, before being exported across the Pacific. In reality, the economic impact of Chinese soybean tariffs would be more deeply felt in the area the soybeans are grown. A similar problem occurs for Louisiana due to the port of New Orleans. These distortions are unavoidable in the OM data but are likely most severe in the case of soybeans. For a complete explanation, see the detail from the International Trade Administration.
[4] USITC DataWeb, U.S. exports of all commodities to China by port district, using F.A.S. values.
[5] Congressional district-level data from USDA (USDA Census of Agriculture, 2012 Census Publications, Congressional District Profile) mapped to district-level 2016 election results (Daily Kos Elections, “Daily Kos Elections’ presidential results by congressional district for 2016, 2012, and 2008,” updated February 2018).
[6] The breakdown is similar if one examines the total value of agricultural production in lieu of total acreage. 79.8 percent of the value of U.S. agricultural production occurred in Republican districts. Farm acreage is the only measure available for specific agricultural items discussed above.